Submission Date
August 6, 2025
Editor: Stefano Bossi
Guest Author: Michele Vischi
Disclaimer
This article stems from the desire to explore the concept of shooting efficiency in modern basketball in a simple and clear way, with the aim of offering players, coaches, and fans a tool for reflecting on the importance of shot selection in relation to actual performance. The focus will therefore be on the concept of Shooting Efficiency.
We will start with terminology (also translated into Italian), then analyze, in descending order, the most efficient shots in today’s game. It is important—and for me, necessary—to mention Michael Arcieri, former Director of Sport Operations in the NBA and current General Manager of Pallacanestro Trieste. When he arrived in Trieste in 2023, bringing this philosophy of play with him, I was fascinated. Thanks to the trust and openness of the club toward this vision, the results soon followed, also due to an approach based on data analytics and advanced metrics, applied with consistency and awareness.
For this reason, I personally asked Michael for permission to share and disseminate these concepts which, although widely adopted and consolidated in the United States, are still too often dismissed in Italy as mere “American gimmicks” valid only overseas.
In August 2023, with Michael’s arrival in Trieste—together with then head coach Jamion Christian—we found a giant “Shooting Hierarchy” poster hanging inside our locker room. For many of us, it was a new and almost disarming concept in its clarity, but over the following months it became a reference point, a shared identity, and, in fact, a true model to follow.
The results speak for themselves: winning the Serie A2 championship and then reaching the playoffs in our first year back in Serie A1 as a newly promoted team. All of this was made possible thanks to the rigorous adoption of this mindset: attacking the rim, creating open and high-efficiency shots, earning trips to the free-throw line, and wisely avoiding low-yield attempts. A simple approach in principle, but revolutionary in its daily application.
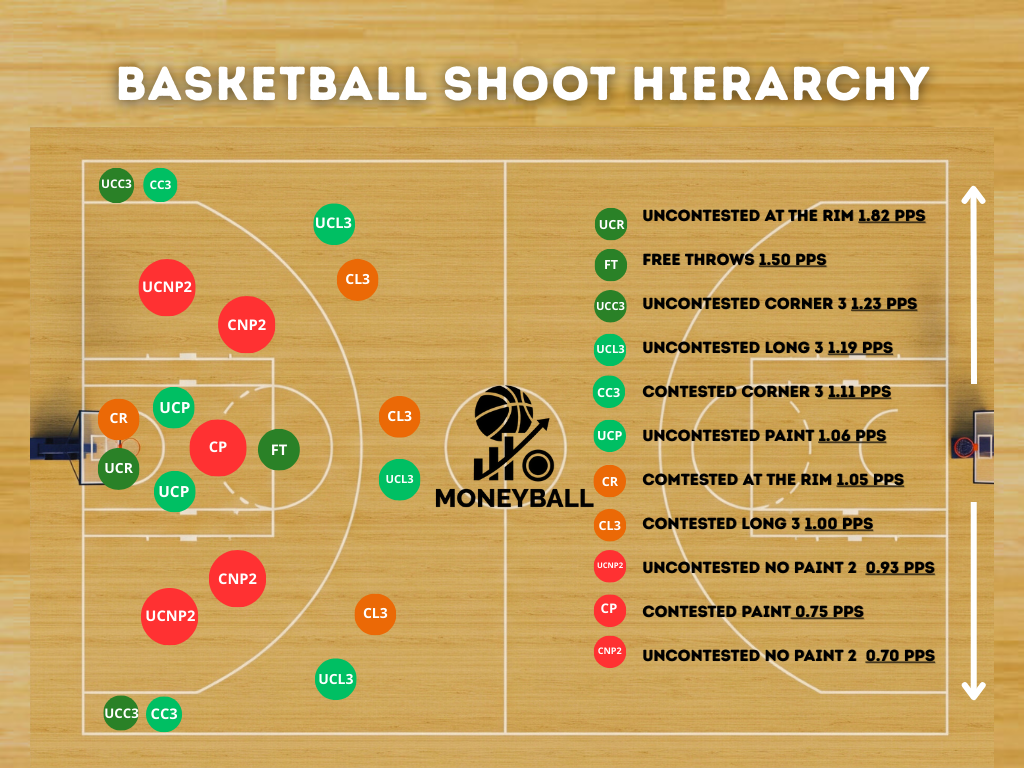
Based on the Shooting Hierarchy shared by Michael, I created a personalized map, adapting the color scale to the different areas of the court. The result is a Shooting Hierarchy Map designed to clearly and visually explain these concepts in detail.
The data in the tables are based on statistical averages from recent NBA seasons and represent a useful starting point for analyzing which types of shots are, on average, most efficient in terms of Points Per Possession (PPS).
It is, however, crucial to emphasize that these numbers must always be contextualized: every league, level of play, or individual player has unique characteristics that can significantly influence the effectiveness of a given type of shot.
Finally, building on the central thesis of the increasing—and sometimes excessive—reliance on the three-point shot as the offensive core of modern basketball, a counter-argument will be introduced, structured and well-documented by Michele Vischi, former player, PhD in Physics, and currently a post-doctoral researcher in Quantum Computing at the University of Trieste.
Through rigorous analysis, enriched with data and personal reflections, Michele proposes a re-evaluation of the much-maligned midrange shot, highlighting its technical, tactical, and psychological value—especially in high-pressure situations and in the hands of elite shot creators.
The journey will conclude with a final synthesis and reflections that aim to go beyond averages and numbers, offering a more complete perspective on real, contextualized, and personalized efficiency in today’s and tomorrow’s basketball.
The goal is not to provide an absolute truth, but rather a useful framework for interpreting and improving the game at all levels.
What you will find in this article:
- 1st Quarter: The Concept of Shooting Efficiency and Shot Selection
- 2nd Quarter: Basketball Court Map and Shooting Zones
- 3rd Quarter: The 3W Model: Who, Where, When
- 4th Quarter: Midrange is not dead: The Case of SGA with Michele Vischi, PhD in Physics
Bonus: Sources, data, tables, and software used
1st Quarter
Introduction – Shooting Efficiency and Shot Selection
In modern basketball, shooting efficiency is no longer just a matter of individual technique, but the result of conscious choices, optimized spacing, and correct reads. Understanding where and how a basket is made has become essential to building an effective offense, training with focus, and making the most of each player’s strengths.
This article was born from the desire to bring order to the numbers, trends, and best practices related to shot selection and efficiency measured in PPP (Points Per Possession). Using updated data from FIBA and the NBA, we will analyze the most profitable areas of the court, the most efficient types of shots, and the average performance by role and situation.
The data are clear: not all shots are worth the same. A layup at the rim does not have the same impact as a midrange jumper, and a corner three can be far more efficient than one from above the break. For this reason, it is essential to know the stats behind each zone and type of shot, in order to make better choices both in games and in practice.
In a context increasingly driven by analytics and resource optimization, this study aims to provide coaches, players, and fans with a tool to understand where offensive advantage is created today, and how to maximize every possession.
What is “Shooting Efficiency” and what does Points Per Shot (PPS) measure?
In modern basketball, every possession is valuable. For this reason, one of the main goals of any offense is to maximize efficiency. But what does it really mean to take an “efficient shot”?
This is where the concept of Points Per Shot (PPS) comes in—the average number of points a player generates every time they attempt a particular type of shot. The higher the number, the greater the offensive return of that choice. It’s a simple yet extremely powerful metric to evaluate the true efficiency of a shot, going beyond mere shooting percentage.
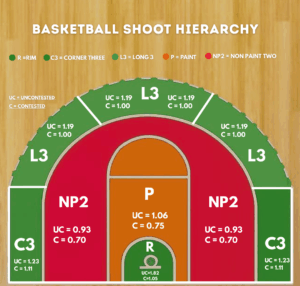
To better understand high- and low-yield areas, it is useful to introduce the terminology used in shot classification, which will guide us in reading the shooting chart:
Shots are first distinguished based on the degree of defensive pressure:
- UC = Uncontested (not contested)
- C = Contested (contested)
Next, each area of the court has a well-defined abbreviation:
- R = Rim (at the basket)
- FT = Free Throw line area
- C3 = Corner 3 (three-pointer from the corners)
- L3 = Long 3 (above-the-break or long-distance three)
- P = Paint (restricted area and mid-paint)
- NP = No Paint (inside the arc but outside the paint, i.e., midrange)
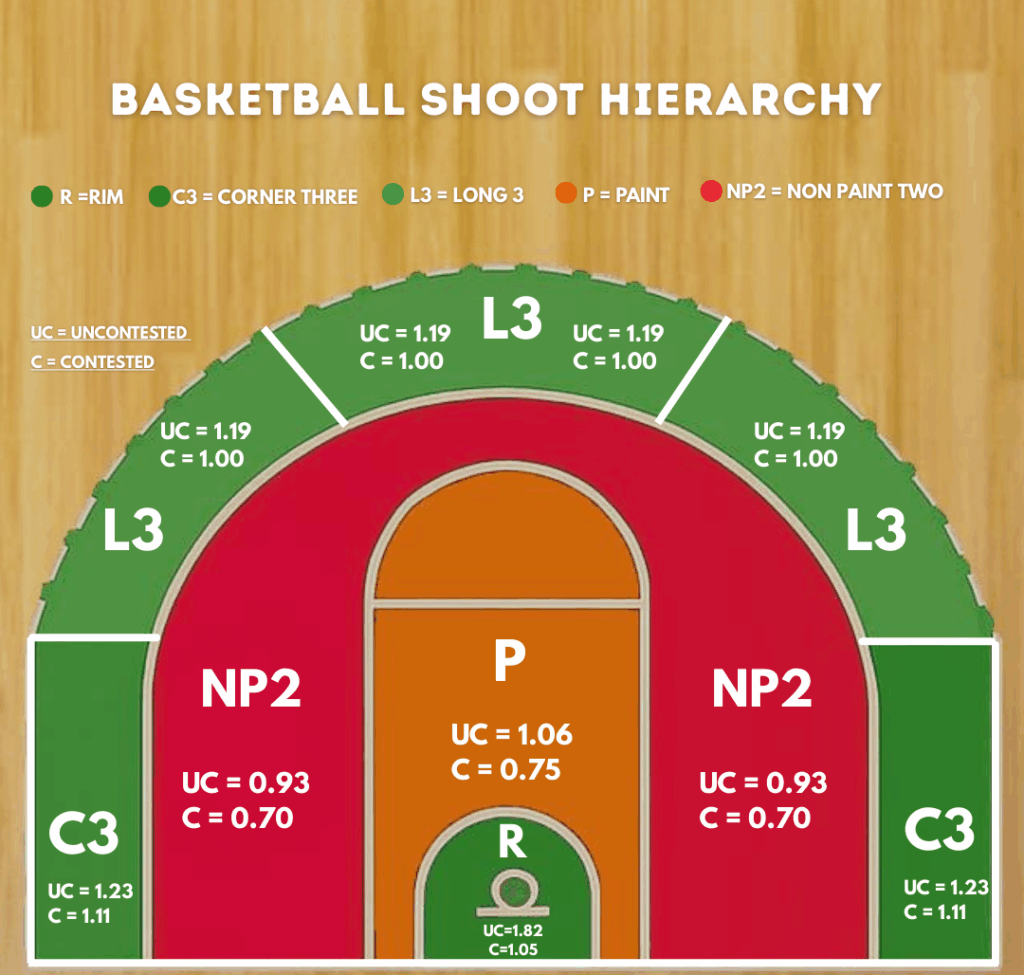
We can summarize this information in a table (Table 1) which, in descending order of efficiency, lists the main types of shots in modern basketball according to U.S. terminology and reference data.
Detailed Analysis of Each Row
🟩 HIGH-EFFICIENCY SHOTS (Light Green / Dark Green Zone)
These shots yield optimal returns in terms of points per attempt.
- UCR – Uncontested at the Rim (1.82 PPS)
Description: Uncontested shot at the rim (layup, dunk).
Tactical note: The single most efficient shot. Absolute priority for any offense. - FTS – Free Throws (1.5 PPS)
Description: Free throws. Average value considering they often come in pairs.
Tactical note: Highly efficient. Drawing fouls and reaching the bonus can increase productivity. - UCC3 – Uncontested Corner 3 (1.23 PPS)
Description: Uncontested three-point shot from the corner.
Tactical note: Very advantageous. The corner is the closest three-point spot to the basket. - UC L3 – Uncontested Long 3 (1.19 PPS)
Description: Uncontested three-point shot from the top/wing area.
Tactical note: A good shot, slightly less effective than from the corner. - CC3 – Contested Corner 3 (1.11 PPS)
Description: Contested three-pointer from the corner.
Tactical note: Even when defended, it remains efficient, showing the high value of corner threes.
🟨 MEDIUM-EFFICIENCY SHOTS (Yellow / Orange Zone)
Shots that produce acceptable, though less optimal, returns.
- UC P – Uncontested Paint (1.06 PPS)
Description: Uncontested shot inside the paint (but not at the rim).
Tactical note: Still valuable, though less than a rim attempt. - CR – Contested at the Rim (1.05 PPS)
Description: Contested shot at the rim.
Tactical note: When defended, even rim shots lose efficiency. - CL3 – Contested Long 3 (1.00 PPS)
Description: Contested three-pointer from the top/wing area.
Tactical note: Around 1 point per shot—still acceptable but marginal.
🟥 LOW-EFFICIENCY SHOTS (Red Zone)
Shots to be avoided whenever possible, as they yield few points per attempt.
- UC NP2 – Uncontested No-Paint 2 (0.93 PPS)
Description: Uncontested two-point shot outside the paint.
Tactical note: The classic midrange jumper. Inefficient, even when open. - CP – Contested Paint (0.75 PPS)
Description: Contested shot inside the paint.
Tactical note: Low yield, highlighting strong interior defense. - C NP2 – Contested No-Paint 2 (0.70 PPS)
Description: Contested two-point shot outside the paint.
Tactical note: The least efficient shot overall. Best avoided.
II Quarter – SHOOTING CHARTS (COURT)
The Shooting Chart
The shot map (or shooting chart) is the lens through which we translate numbers into actual playing spaces. Below is a practical guide for interpreting it effectively.
Court Segmentation
The hardwood is divided into coded areas (restricted area, paint, short/long mid-range, corner 3, long 3). Each segment corresponds to a homogeneous set of shots sharing distance, angle, and defensive traffic level.
Shot Type and Contest Level
For each zone, the chart distinguishes between:
- Uncontested – the shooter faces no direct pressure (late close-out or defender >1m away).
- Contested – the defender affects the mechanics (hand up, body contact, close-out within 1m).
Points Per Possession (PPP) Value
Each zone + contest combination is assigned an efficiency coefficient expressed in PPP. The higher the value, the greater the average return of that attempt over a season.
Color Coding
- 🟢 Green (PPP ≥ 1.20) → highly profitable shot
- 🟠 Orange (1.00 ≤ PPP < 1.20) → neutral or situational choice
- 🔴 Red (PPP < 1.00) → option to be limited unless the shooter has specific skills
Statistical Contextualization
The coefficients are derived from multi-year NBA/FIBA averages: they serve as a reference, not dogma. League variations, pace, individual talent, or defensive matchups may shift actual values.
Practical Use
- Coaches & Staff: design spacing offenses to generate a majority of green zones (UCR, UCC3) and minimize red zones (C-NP2).
- Players: visualize their own hot spots to train high-yield shots and recognize when to pass on inefficient ones.
- Analysts: compare team and individual shot profiles to build defensive game plans (e.g., allow midrange to a poor shooter, close out aggressively on a corner specialist).
With the “primer” provided by the terminology table in the previous chapter, the chart stops being just a colored graphic and becomes a tactical navigator: every box shows the average value of that shot per possession and tells you whether to hit the gas or pump the brakes in a given area of the court.
A Practical Example
If we look at the green zones, we notice how uncontested corner threes and uncontested layups are among the most profitable shots. In a well-structured system, creating these opportunities must be a priority.
Conversely, contested mid-range shots—such as defended pull-ups—should be avoided unless the team has an elite-level scorer from that area.
So let’s put what we see into context.
Data must be used carefully—not as an absolute truth.
“You need the numbers. But you need the people, too. Data should inform decisions, not make them.”
— Daryl Morey
📊 Numbers aren’t enough: context, interpretation, and human judgment are essential.
Understanding shooting efficiency is only the first step toward turning analytics into a real competitive advantage. Numbers help us identify which shots are more efficient than others, but they cannot, on their own, build an effective offense. Context is needed, and above all, people—coaches and players—capable of reading the game, adapting, and making real-time decisions.
The data clearly shows that some areas of the floor produce higher-efficiency shots: in particular, rim finishes (PPS 1.82) and corner threes. Building an offense around these “hot zones” makes sense, but that sense must be developed through daily practice, tactical planning, spacing, and situational awareness. It does not mean forcing every possession to end in a corner three as if it were an isolated objective.
For example, a team that commits to relentlessly attacking the rim may not only generate more high-percentage baskets, but also draw fouls and earn free throws (PPS 1.50). But there’s more: each drive creates paint touches, which, even if not finished, often lead to kick-outs for open shots. When the defense collapses to stop the driver, passing lanes open up to shooters. In this context, corner threes become a natural, highly efficient outcome—generated by a well-executed drive-and-kick or by an extra pass, such as a swing from the slot to the corner against a rotating defense.
This can therefore be a key perspective for interpreting the shot chart.
Teams can also use shooting efficiency data defensively, game-planning to take away the opponent’s most efficient shots and funnel them into less profitable solutions. By analyzing opponents’ shot charts and identifying their most dangerous zones and players, the coaching staff can design a plan to deny rim attempts, limit corner threes, and force mid-range shots, which are historically less efficient. The key is to tailor the defense to the opponent, avoiding unnecessary help, controlling pace, and adapting coverage rules to each offensive profile. It’s not just about defending with intensity, but with intelligence: using the data to decide where you’re willing to be beaten—and where you’re not.
In summary: data tells us where to go, but basketball explains how to get there. The real strength lies in balancing numbers, intuition, and preparation.
“We don’t make decisions without data, but we don’t make decisions based only on data.”
— Jeff Bezos
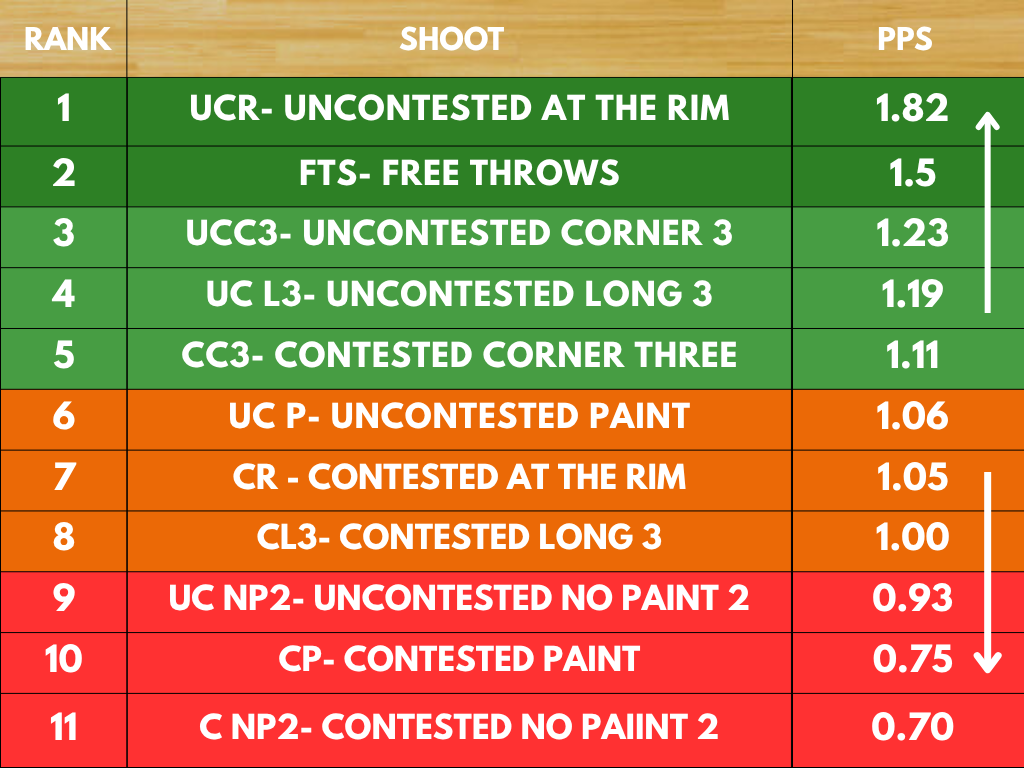
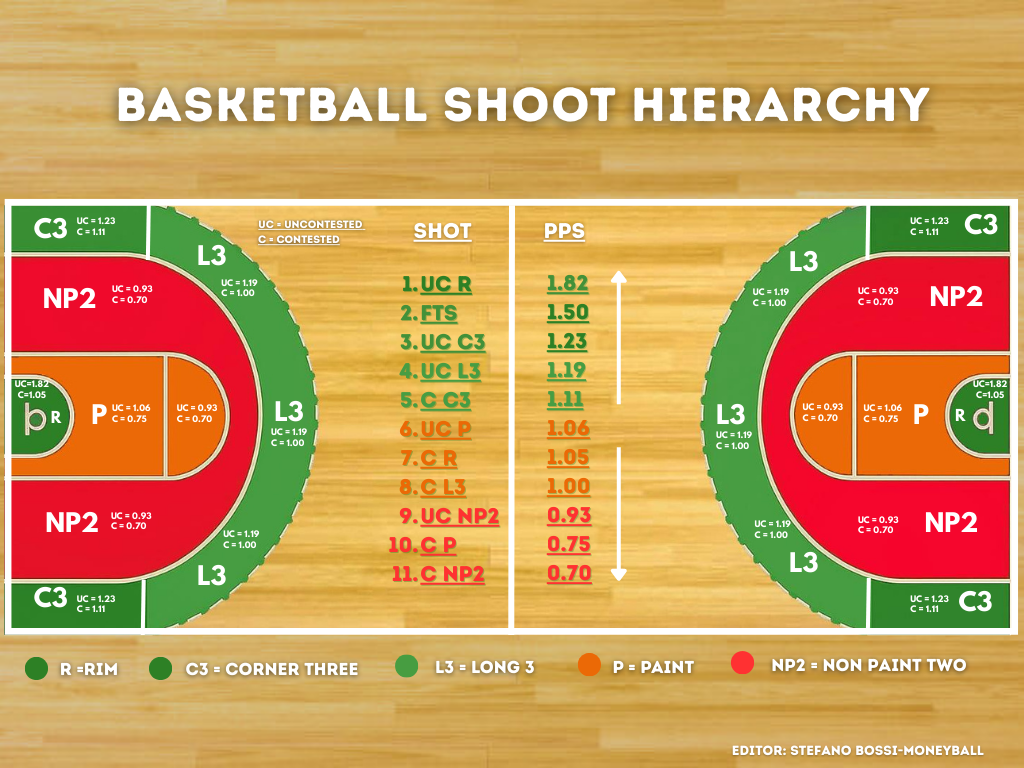
The Second Table: Shoot Efficiency Chart
This second chart is a “Shoot Efficiency Shooting Chart,” different in design but reporting the same data as the main shot map. It is essentially a comparative graph of shot efficiency in basketball, based on Points Per Shot (PPS).
Shots are ranked in descending order of efficiency—that is, from the shot that generates the most points on average to the one that generates the least.
In the following table, we take a more detailed look at the court zones and their respective PPS values. Another perspective for reading the same data.
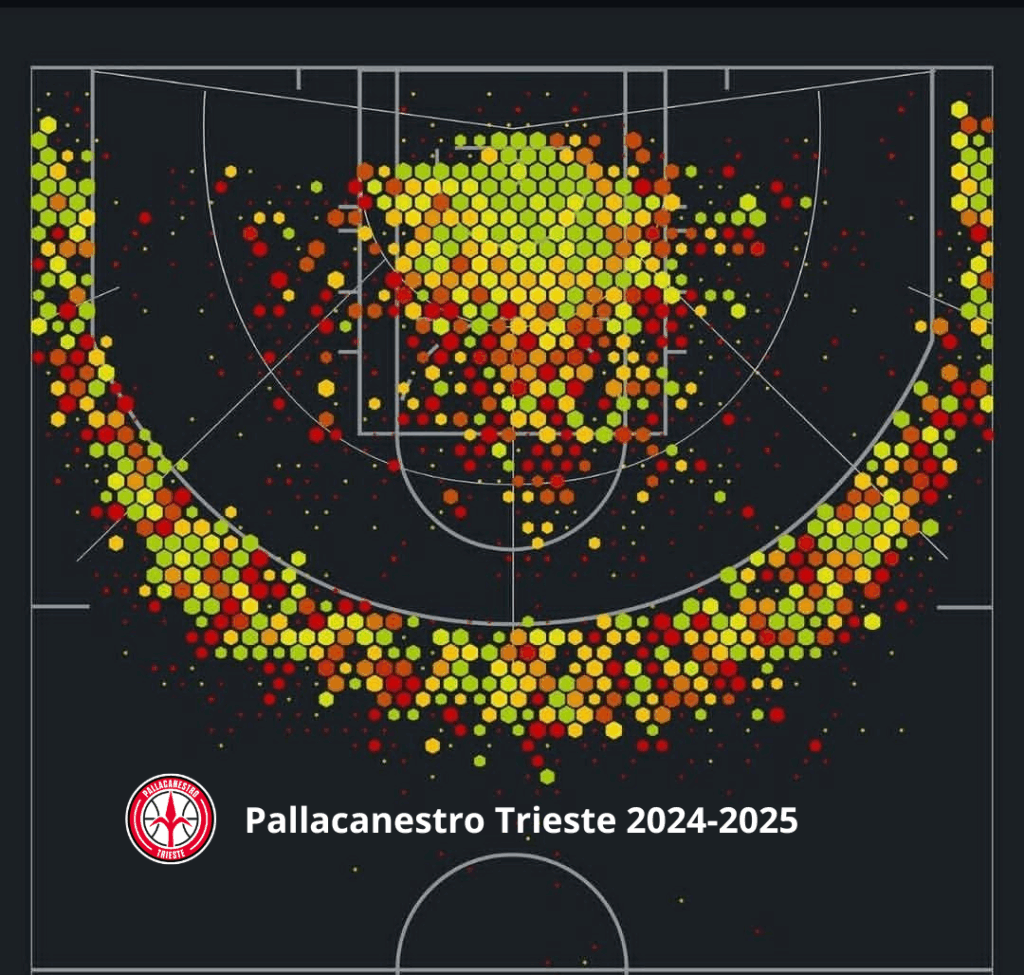
To conclude this paragraph, I’d like to share the shot chart of our team over the 2024–2025 LBA season. The key takeaway here is how to put theory into practice — translating the concepts conveyed through the shooting hierarchy, as explained by Michael and Jamion, directly onto the court. This demonstrates the practical application of strategic principles, turning analytical insights into real-game decision-making and execution
3rd Quarter: The WHO – WHEN – WHERE Model Proposal
A matrix to evaluate the real efficiency of a shot
The NBA 2K Model: Contest and Timing
Many basketball fans have played NBA 2K, the most advanced basketball simulation video game. Backed by top-level analysts and engineers, it has for years implemented an algorithm that evaluates every shot based on two factors, making the simulation more realistic than ever.
The shot evaluation system is based on these factors:
- Contest Level: No Contest, Light, Heavy
- Release Timing: Early, Excellent, Late
This evaluation returns a Grade that summarizes the probability of success. This logic, already validated on a global scale, is the backbone of our visual system with colors:
| Color | Contest | Category |
|---|---|---|
| 🟩 Green | No Contest | Efficient |
| 🟨 Orange | Light | Acceptable |
| 🟥 Red | Heavy | Inefficient |
While NBA 2K24 provides a simplified yet educational representation of shot quality, in professional basketball the evaluation of shot selection requires a more complex and multilayered integration of data.
The framework I propose is built on three fundamental dimensions, summarized in the so-called 3 W’s:
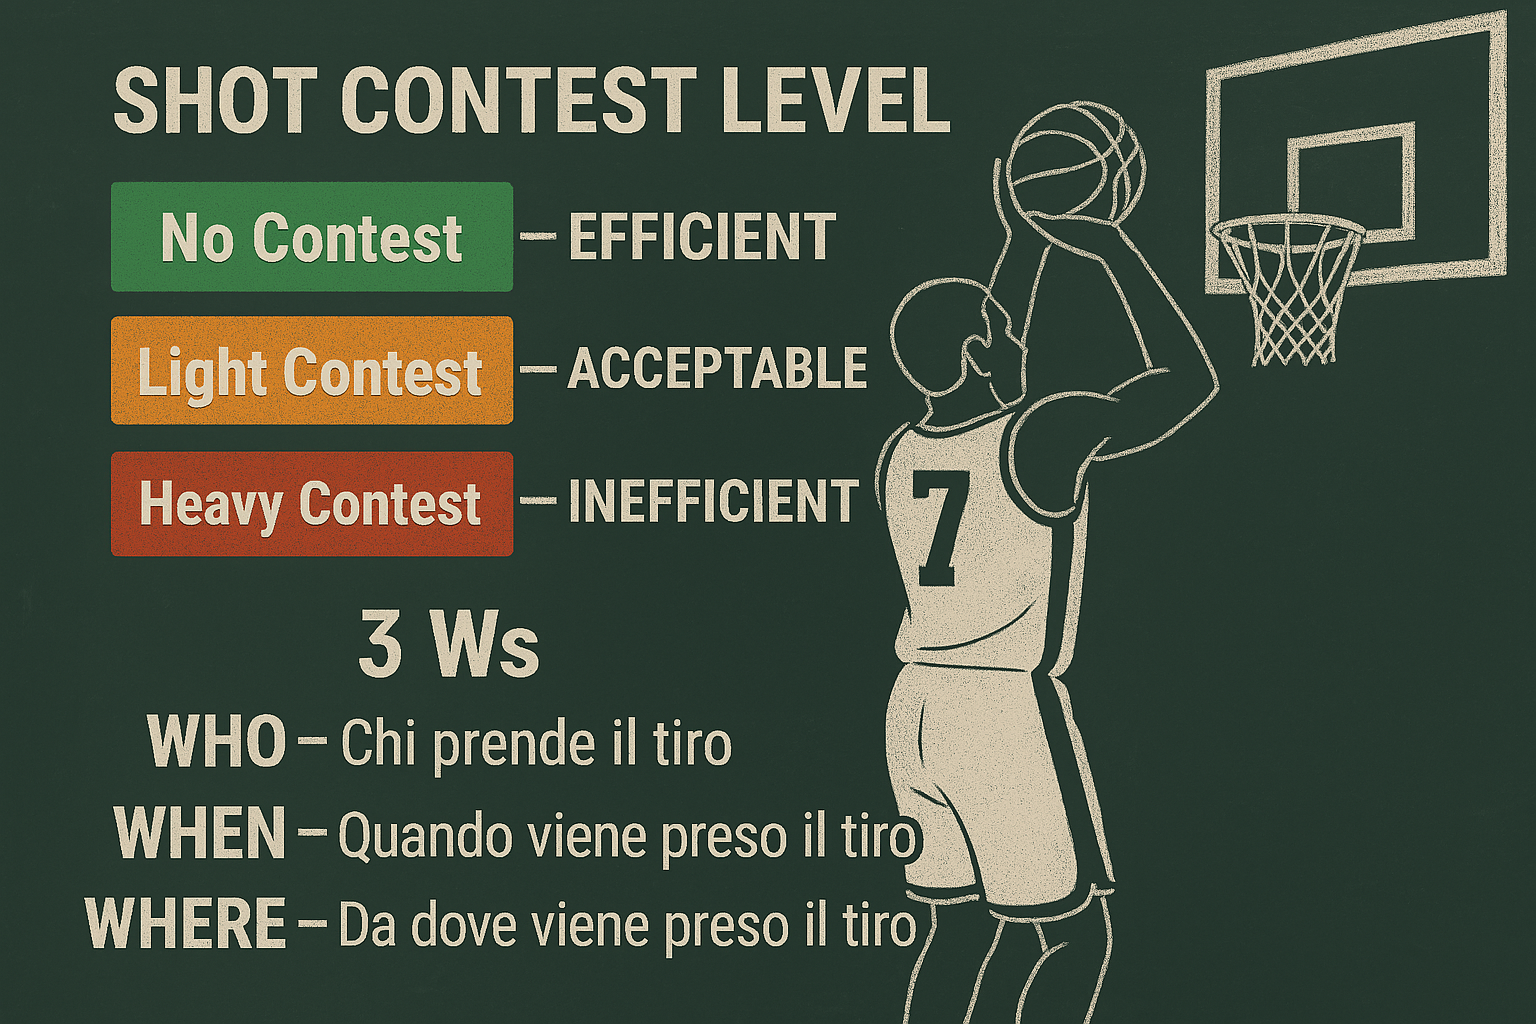
WHO – Who Takes the Shot
Every player has a different shot quality baseline, determined by:
- Actual shooting percentages in catch-and-shoot, off-the-dribble, and pull-up situations;
- True Shooting % (TS%) and Effective FG% (eFG%);
- Shot difficulty weighted average (performance adjusted by the difficulty of shots taken);
- Shot creation ability (percentage of shots self-created vs. assisted);
- Contest-resilient metrics (effectiveness under defensive pressure).
Real examples (source: NBA Stats, Synergy, InStat):
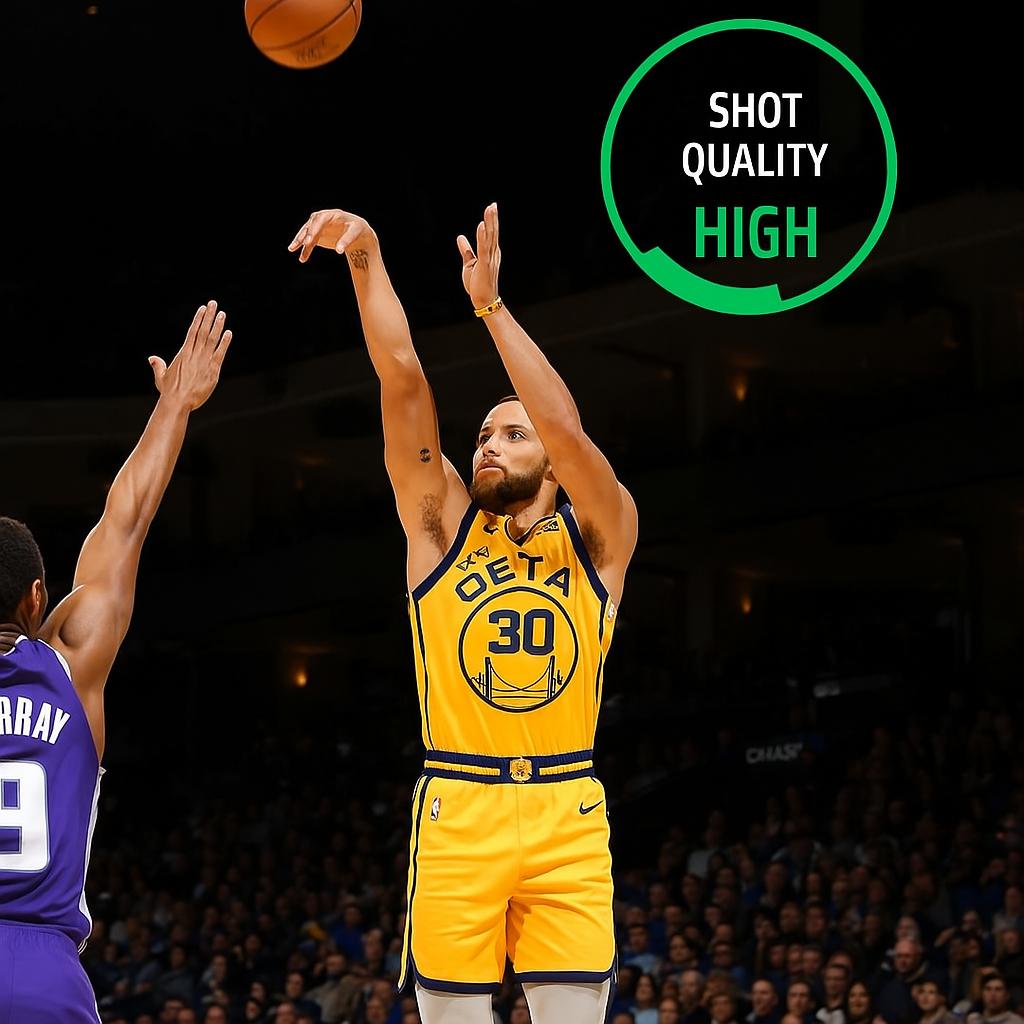
- Stephen Curry (2023–24): 41.2% from 3 on 11 attempts per game → High green zone shooter, even under light/heavy contest.
- PJ Tucker: 36% from 3 but only from the corner, exclusively catch-and-shoot → Green only in very specific contexts.
🟢 A 30-foot shot by Curry might still be rated “green,” while the same shot taken by a big man with limited range should be classified as “red,” even with no contest.
WHEN – When the Shot is Taken
Timing and game phase strongly determine shot quality:
- Early clock (<20s): often less efficient, unless in transition or completely wide open.
- Optimal clock (10–4s): peak average efficiency (according to Second Spectrum, best points per possession occur between 9 and 6 seconds).
- Late clock (<4s): generally forced attempts → higher shot difficulty and lower eFG%.
+ Bonus temporal context:
- Score differential (tie game, leading, trailing).
- Clutch time performance (last 5 minutes, game within 5 points).
🔶 A shot taken by a great shooter with 20 seconds still on the shot clock might be graded orange: “premature.”
At the same time, a midrange shot taken by an elite player with specific skills, in a specific game context, can still be graded green — even though, as seen earlier, the average points per possession of a “Contested No Paint” attempt is only 0.70 PPP.
We will later explore an interesting chapter on SGA.
WHERE – Where the Shot is Taken
Not all two-pointers or three-pointers carry the same value. Modern analysis (NBA, EuroLeague, Synergy) divides the court into high- and low-efficiency zones:
- Corner 3s → extremely high eFG% (~1.2 PPP, points per possession).
- Above-the-break 3s → efficient when taken in rhythm or by specialists.
- Long midrange (14–22 feet) → typically inefficient (<0.9 PPP).
- Restricted area → the most efficient zone, with conversion rates above 60% on NBA averages.
According to Cleaning The Glass, the long midrange is the least productive area in terms of points per shot attempt, while corner 3s and restricted area finishes rank as the most efficient options.
🟥 A heavily contested, off-balance midrange attempt should be graded red — even if taken by a skilled guard. The same evaluation applies to a No Paint 2 (a two-point jumper outside the paint).
📊 Final Example Matrix: Color & Score Evaluation Model
| WHO (Player) | WHEN (Timing) | WHERE (Zone) | CONTEST | COLOR | RATING |
|---|---|---|---|---|---|
| Elite shooter | End of clock | Corner 3 | Light | 🟢 | 9.0 |
| Limited big man | Early clock | Long midrange | No | 🔶 | 5.5 |
| Role player | Late clock | Above the break | Heavy | 🔴 | 3.0 |
This system makes it possible to standardize shot evaluation, moving beyond raw percentages and creating an adaptable predictive model.
✅ Practical Applications
- Coaches: identify “allowed” and “not allowed” shots for each player within each set.
- Analysts: track average shot quality for both the team and individual players.
- Players: receive immediate feedback on their shot selection (similar to NBA 2K).
- Youth & Mini-basketball: train young players early on to recognize good vs. bad shots by associating each attempt with a color.
Color – Contest – Category
- 🟩 Green → No Contest → Efficient
- 🟨 Orange → Light → Acceptable
- 🟥 Red → Heavy → Inefficient
In the coming months, this concept will be further developed into a more concrete framework.
IV QUARTER
Midrange is not dead
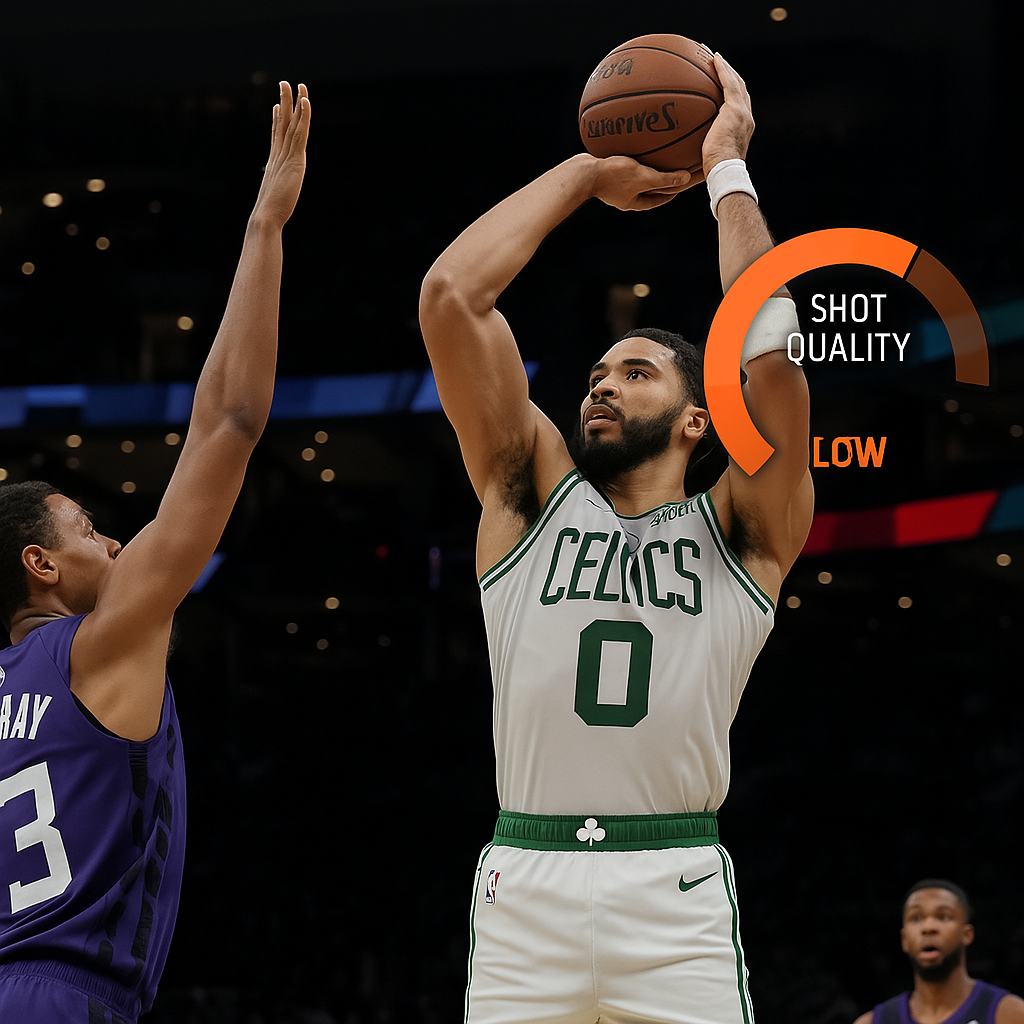
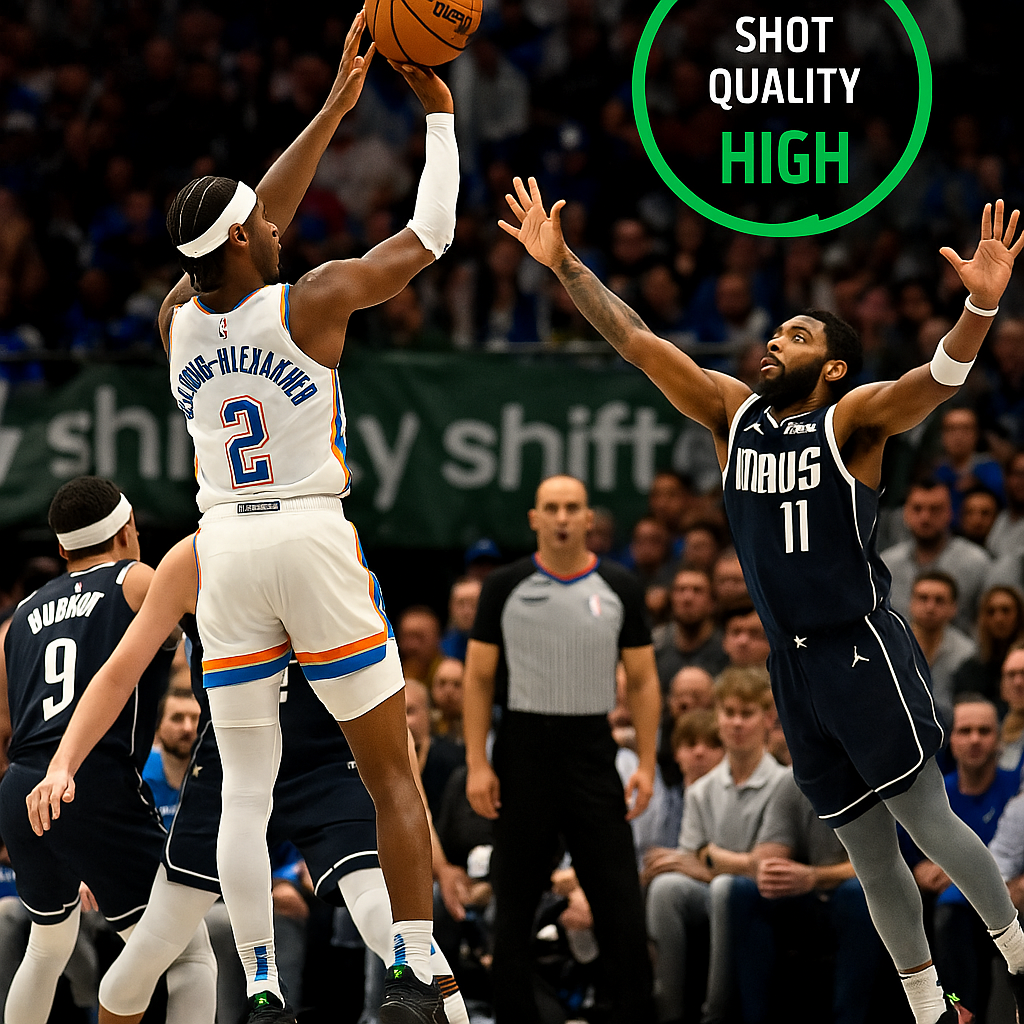
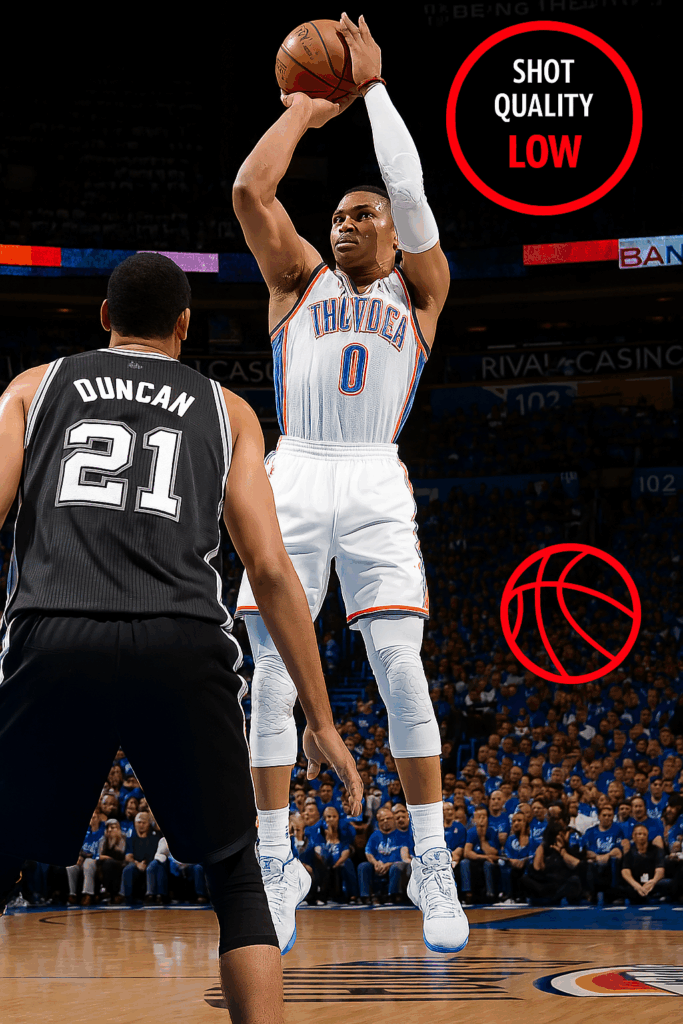
What we outlined in the previous quarters shows the impact that data analytics has had on how teams structure their offense. This new approach necessarily changes defensive strategies as well, which leads to some very interesting considerations regarding midrange shots.
From an offensive standpoint, for a role player it has become more valuable to be consistent and reliable from three. In the next section we will see how, even though the three-point shot is biomechanically more demanding and complex, it is in fact more reproducible and trainable compared to midrange shots. The latter require greater control and adaptation depending on the situation and the spot on the floor — which is why they are now reserved for elite shot creators.
“For the average fan, we don’t shoot midrange shots anymore. We’ve taken them out. That’s not true. Role players don’t shoot midrange shots anymore. The role player in our league nowadays has to be able to guard multiple positions, has to be able to make threes. It’s a bonus and growing if they can attack a closeout and start the blender.”
— Steve Nash
From a defensive standpoint, the most obvious strategy is to limit open threes as much as possible, while conceding contested midrange attempts instead.
In this context — and especially in high-level games where tactics and adjustments on both ends dominate — mastering the midrange becomes crucial. The midrange jumper can become a lethal weapon, and it’s wrong to label it simply as a “less valuable shot” that should always be avoided. As Steve Nash pointed out, the midrange is devastating for defenses also on a mental level. Beyond the numbers, the human side of the game matters: if an elite player starts dominating from midrange, it becomes almost impossible not to doubt the defensive game plan.
As someone with a PhD in physics and a strong mathematical background, I’m naturally inclined to lean on numbers — but I’ve also been a player and I know that the human factor cannot be separated from the mechanical one. On the court, there are human beings, not robots or number-crunching machines.
“What happens is, you may not be leaving the game plan, but you’re leaning. You’re thinking, instead of playing instinctively.”
— Steve Nash
We can also support the importance of midrange shooting with data.
In recent years, the change in shot selection across the NBA has been dramatic. We can visualize this clearly by looking at the last 25 years. The following charts, generated via nbavisuals.com, show the trend:
- Long midrange attempts have drastically declined. From 2001 to 2025, their frequency dropped from an average of ~30 per game to fewer than 5–10.
- Three-point attempts have skyrocketed in the same span, increasing from ~10 per game to ~35–40.
The trend is unmistakable: while the midrange has lost volume, its selective and tactical use has become even more meaningful.
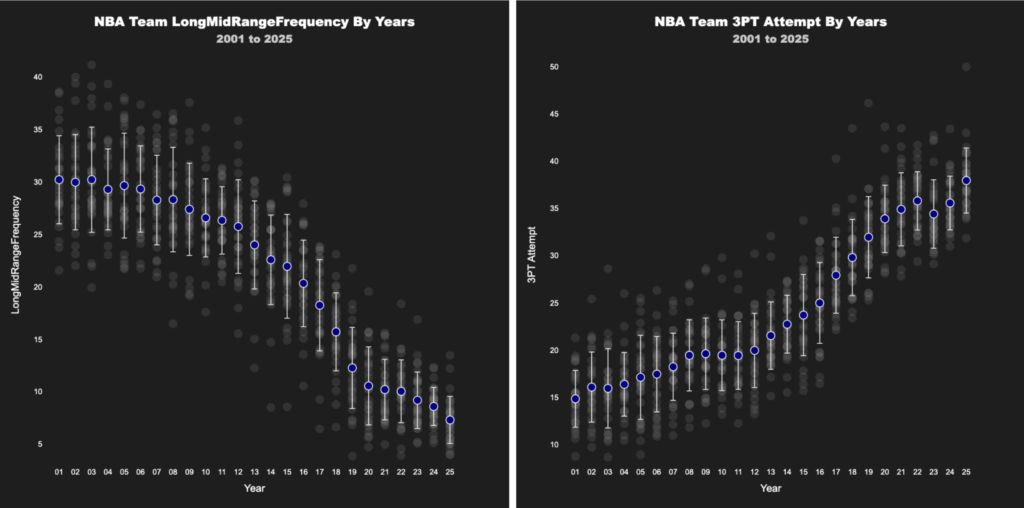
On the left: average frequency of long midrange shots taken by NBA teams from 2001 to 2025.
On the right: average number of three-point attempts over the same period.
Long midrange attempts have steadily decreased, while three-point attempts have seen a sharp increase.
It is important to note, however, a crucial point: lower shot volume does not necessarily mean lower efficiency. On average, teams have remained fairly consistent over the years in both their three-point shooting percentage and their long midrange percentage — as highlighted in the charts below.
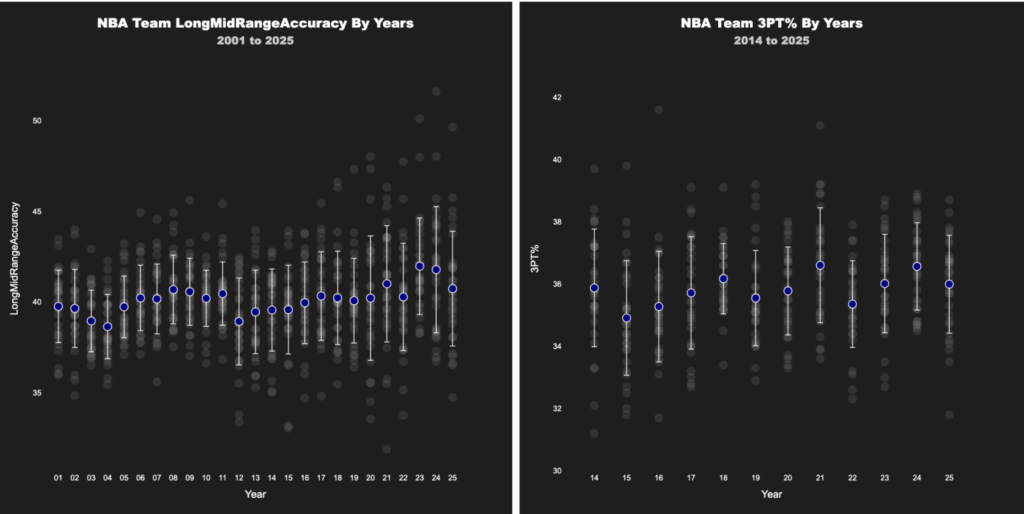
On the left: average shooting percentage on long midrange attempts by NBA teams from 2001 to 2025.
On the right: average three-point shooting percentage from 2014 to 2025.
In both cases, the average percentages have shown only minor fluctuations over the years.
The most interesting data point, however, concerns short midrange shots. The two charts below highlight a particular trend: after a slight decline in short midrange frequency between 2001 and 2010, not only did the volume of these shots begin to rise again, but the efficiency at which they are converted has also improved.
The overall trend is positive — a clear indication that short midrange attempts can still serve as highly valuable weapons, and that their effectiveness has actually increased in recent years.
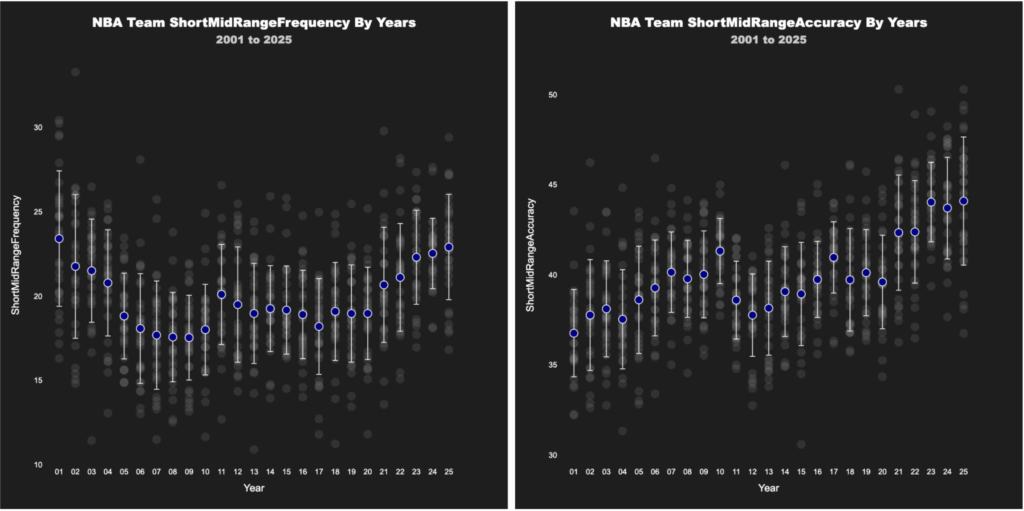
On the left: average frequency of short midrange shots taken by NBA teams from 2001 to 2025.
On the right: average short midrange shooting percentage from 2001 to 2025.
The data shows that frequency has slightly increased in recent years, while accuracy has improved steadily over time.
OKC vs IND Finals
We can also carry out additional analysis regarding the success of the two 2024/2025 finalists: the Oklahoma City Thunder and the Indiana Pacers.
First, let’s compare their shot selection during the playoffs. In the two charts below, we can observe how the frequency of shots varies depending on distance from the basket.
The resulting trend (red curve in both charts) for each finalist is compared against the average trend of all other playoff teams (blue curve in both charts).


At the top, the red curve shows the shot frequency of the Indiana Pacers based on distance from the basket during the 2024/2025 playoffs. The blue curve represents the average trend of the other NBA teams.
In the bottom chart, the red and blue curves have the same meaning as in the top chart but refer to the Oklahoma City Thunder. Both charts show two clear peaks: shots near the rim and three-point attempts. Additionally, both teams took more midrange shots than the league average.
First, we can immediately see how these charts align with the shot charts defined in previous quarters. The league-wide average trend shows two prominent peaks in shot frequency: close-range shots near the rim and three-point shots.
The really interesting aspect of these charts is that both the Pacers and the Thunder had a higher frequency of shots from 10–15 feet compared to the average. Among other things, OKC also had a higher frequency of rim attempts than average, demonstrating their ability to dominate the paint.
But it’s not just the frequency that stands out. In the 10–15 feet zone, both Indiana and OKC had a significantly higher effective field goal percentage (eFG%) compared to the league average. This is highlighted in the two charts below. As before, the red curve shows the trend by distance, while the blue curve represents the average trend of the other NBA teams.


At the top, the red curve shows the eFG% of the Indiana Pacers based on distance from the basket during the 2024/2025 playoffs. The blue curve represents the average trend of the other NBA teams. At the bottom, the red and blue curves have the same meaning as the top chart but refer to the OKC Thunder. Both charts show two peaks in shots between 10 and 15 feet, indicating that both teams shot better from midrange than the NBA average.
For Indiana, the highest percentage in the 10–15 feet range was around 15 feet, while for OKC it was around 12–13 feet.
This type of analysis supports the idea that the success of these two teams can also be linked to their effectiveness in more difficult and less standardized shots, namely midrange shots.
Indeed, despite substantial differences between OKC and Indiana, there are additional similarities that contributed to their success during the 2024/2025 playoffs source.
Both teams were among the best in average seconds per touch, meaning they favored quick decisions. With relatively high frequency, these decisions involved dribbling and attacking the paint. But the real strength of both teams was their ability to combine quick, high-point-value decisions when the defense was out of position with efficiency in more complex shots when the defense was well set.
In the table below, we can correlate win probability in the Finals with eFG% on pull-up shots:
| Game | Pull-up eFG% | Winner |
|---|---|---|
| IND | OKC | |
| Game 1 | 42.9 | 37.0 |
| Game 2 | 40.9 | 48.0 |
| Game 3 | 61.5 | 40.7 |
| Game 4 | 26.1 | 31.3 |
| Game 5 | 30.8 | 31.3 |
| Game 6 | 43.2 | 50.0 |
| Game 7 | 49.3 | 46.6 |
Of the seven Finals games, only in Games 6 and 7 did the team with the better eFG% lose the game.
These considerations relate to the team as a whole, but a special mention goes to the player who best embodies midrange efficiency: the ultimate victory of OKC is intimately tied to their best player, Shai Gilgeous-Alexander.
Shai Gilgeous‑Alexander: Master of the Midrange and Total Efficiency
In an era where every possession is carefully dissected, every shot is calculated like a financial asset, and every player is categorized within Expected Shot Value percentages, Shai Gilgeous-Alexander chose the harder path: the path of art.
While modern basketball, from Golden State onward, has revolved around the binary logic of “layup or three,” drowning the midrange in a red haze of inefficiency, the Canadian in Oklahoma City took that area of the court and made it his throne.
This is not a story of nostalgia or a praise of aesthetics for its own sake. It is a story of effectiveness, dominance, and—above all—individuality. Because while NBA averages discourage midrange shots, averages cannot capture the individual. And Gilgeous-Alexander is not an average player.
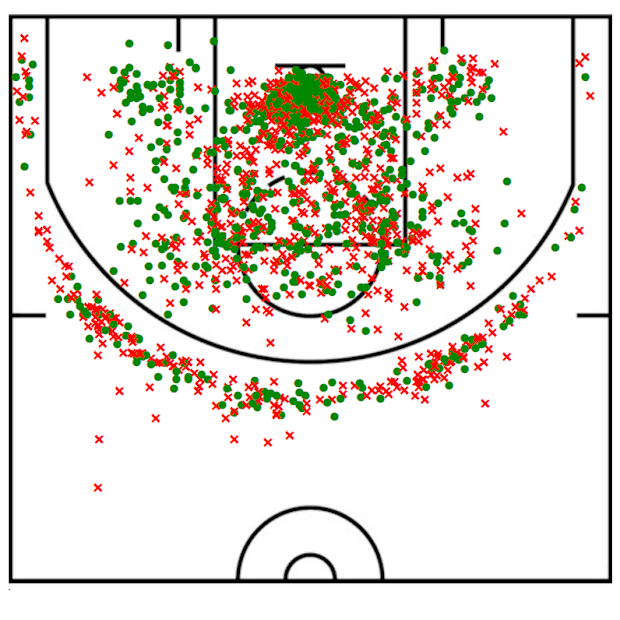
In this shoot chart, we can see that during the regular season, in the midrange zone, he shot 57% compared to the league average of 45%. But even his shot volumes make SGA unique in today’s NBA.
During the playoffs, Shai attempted 9.2 pull-up 2-pointers per game, making 45.6%. No one even came close to averaging 9 pull-ups per game. Furthermore, limiting the analysis to short midrange shots, Shai shot 50%, almost always without assistance, creating his own shots.
In short, Shai was extremely efficient on all those shots that opposing defenses dread conceding.
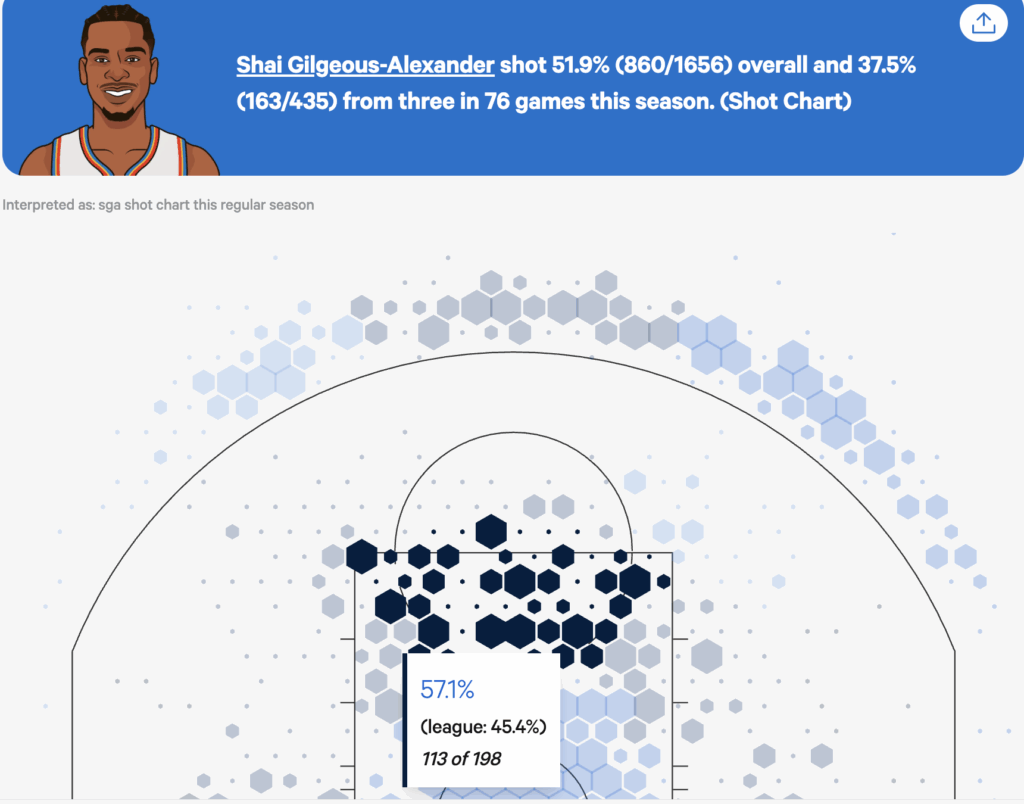
https://www.statmuse.com/nba/ask/sga-shot-chart
The Paradox of Efficiency
In the first chapters (“Shooting Efficiency”), I built a clear path: in modern basketball, some shots “are worth more.” Uncontested layups, corner threes, free throws — it all makes sense. And in theory, it all holds together.
Then comes Shai. In the 2024–25 season, he averaged 32.7 points, shooting 51.9% from the field, 37.5% from three, and — most notably — over 50% from midrange. Numbers that don’t exist in the traditional analyst’s vocabulary.
In a season dominated by extreme spacing and insane three-point volume, Gilgeous-Alexander chose complexity. And he made it simple.
“For me it was just part of the game. It was a skill set, a weapon.”
— Shai Gilgeous-Alexander
This statement, made during the 2025 All-Star Break, says it all. Midrange is not a romantic relic of basketball past. It is a weapon, and he is its greatest practitioner.
Questa dichiarazione, rilasciata durante l’All-Star Break 2025, spiega tutto. Il midrange non è il residuo romantico di un basket passato. È un’arma. E lui ne è il massimo interprete.
Anatomy of a Silent Dominance
There are at least four dimensions of his game worth a deep dive:
1. Smart Volume
SGA doesn’t shoot a lot of threes. He’s not Steph, not Lillard, not even Doncic. What he does is selectively shoot: he shoots when he has space, when the rhythm is right, when the defense is forced to recover. His 37.5% on moderate volume is exactly what is needed to keep defenses honest.
What makes the difference is that nearly half of his shots come from midrange. In the 2025 postseason, he converted 53% of his pull-ups from 8–16 feet, a figure usually seen near the rim. But he does it balanced, even on one leg, with a defender on him.
In the 2024–25 regular season, he made over 220 midrange baskets, second only to DeMar DeRozan. The difference? Shai was far more efficient, doing it as the primary offensive option on a 57-win team.
2. Three-Level Game
Gilgeous-Alexander is an anomaly because he attacks vertically. He’s not a pick-and-roll passer like Doncic, nor a dynamic shooter like Curry. He is a soloist playing three instruments simultaneously: drive, midrange, and passing lanes.
- NBA leader in drives per game.
- Scored 302 layups and dunks, more than Giannis.
- Has one of the highest True Shooting % in clutch situations (70.7%).
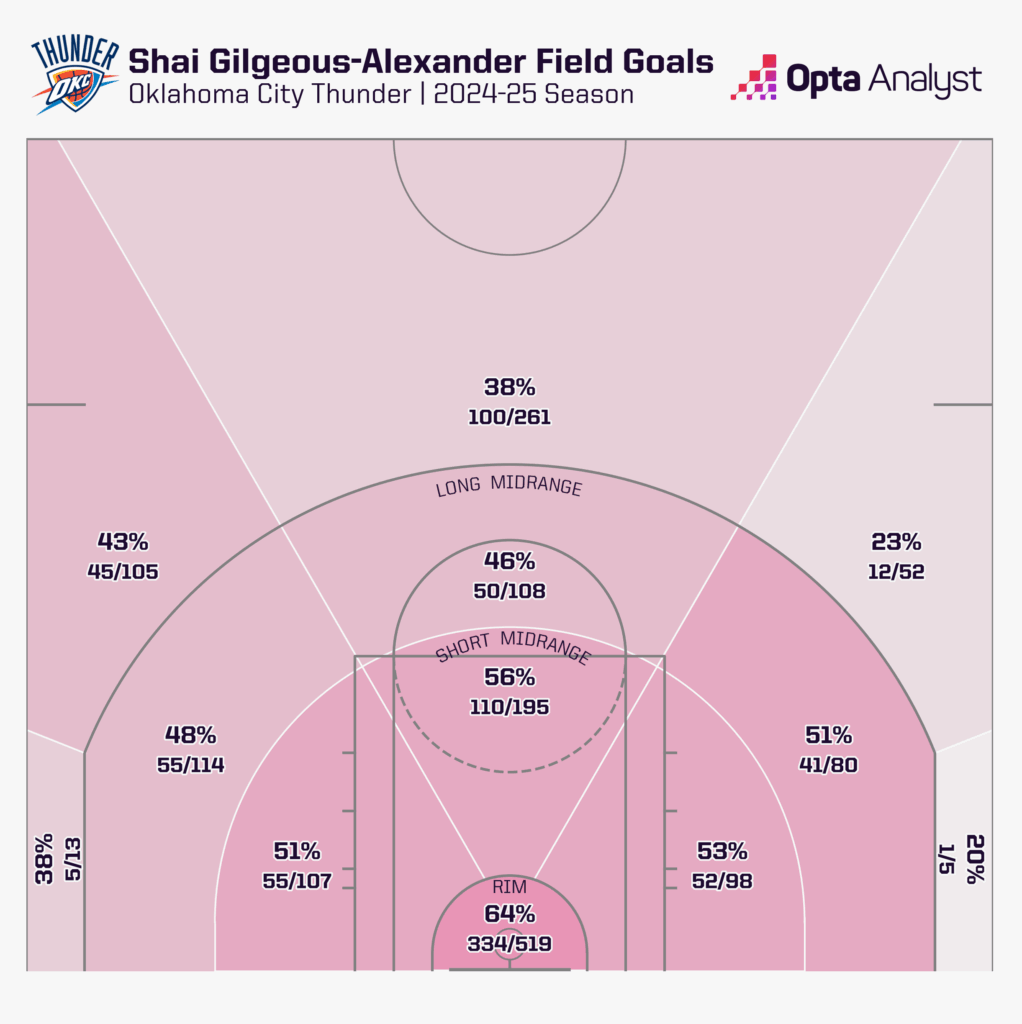
The midrange becomes a bridge — a natural transition from the rim to the three-point line. And it’s not just efficient: it’s inevitable. Step-backs, stop-and-pops, spin moves at the elbow… every defensive action funnels him there, and that’s where he strikes.
Below is SGA’s shooting map chart.
3. Time Control
What makes Shai unique is not just where he shoots, but when he shoots.
In an era of early offense and transition threes, Gilgeous-Alexander slows the game down. He takes the time to read. He’s a player who makes the entire game follow his rhythm. A ball-handler who plays slowly but with high intensity.
You see him change pace after the first dribble, lift his head, throw off the defender with a body fake. Then, with two long steps, he stops, rises, and shoots. From that no-man’s land between 12 and 18 feet, where everyone tells you not to go.
But he lives there.
4. Aesthetics as Function
Gilgeous-Alexander’s shot is clean, geometric. Feet set, release soft, follow-through elegant. It’s not showtime. It’s design. His efficiency stems from a basic principle: form is substance.
Those who compare him to Jordan or Kobe do it not just for style. They do it because, like them, he made the difficult — a midrange jumper, balanced, contested — a high-percentage shot. And he did it under the rules of modern analytics
The Response to the Three-Point Cult
The dominant narrative says: “Either go to the rim or shoot threes. Everything else is inefficient.” And it’s true, if you look at averages, if you check the PPS table.
Then players like Shai appear and remind us that exceptions exist and must be understood. Not ignored.
His 2024–25 season proves that:
- You don’t need to shoot 10 threes per game to be MVP.
- You don’t need to abandon skill for statistics.
- You don’t need to conform to a single truth to win.
Shai took the principles of efficiency — spacing, selection, shot quality — and applied them to the midrange, usually a red zone on shot maps. But with him, those zones turn green. Literally.
Conclusion: Efficiency Is (Also) a Matter of Talent
The goal of this article was twofold: to provide practical tools to understand shooting efficiency in modern basketball, and to stimulate deeper reflection on the meaning of efficiency itself.
We learned that numbers matter.
That some areas of the court, like the corners or the rim, generate a higher offensive return.
That the concept of Points Per Shot (PPS) is a valuable tool for evaluating every attempt.
But we also learned that not everything inefficient on average is inefficient for everyone.
And that talent, preparation, and game reading can bend statistics — not deny them, but surpass them.
Shai Gilgeous-Alexander is not an argument against analytics. He is the argument that completes analytics.
In 2025, the midrange is not dead. It has only become exclusive, reserved for those with the technical, mental, and physical tools to dominate it. Those who do not hide behind numbers, but bend them to their will.
Efficiency, in the end, is like freedom: it only makes sense when it can be personalized.
And Gilgeous-Alexander, in his kingdom 15 feet from the rim, is its most authoritative defender.
Key Takeaways
- Three-point shooting is not just a trend but a rational, strategic choice.
- Midrange, though demonized by many analysts, can be a lethal weapon in the hands of a master.
- Game personalization separates rigid systems from truly efficient teams.
- Contest, timing, role: every shot matters only in the right context, at the right time, in the right hands.
- Shai Gilgeous-Alexander shows that numbers are important, but even more important are players who can read and interpret them.
- There is an efficiency beyond the chart, made of rhythm, spacing, grounded feet, balance, and confidence.
Practical Insights
| Audience | Application |
|---|---|
| Coaches | If a player has feet, change-of-pace, and stop-and-pop, midrange shooting is worth practicing even today. |
| Players | Midrange is not a relic; it’s a tactical and technical level that can open up opportunities at the rim and open shooting lines. |
| Analysts/Scouts | Distinguish between “shot chart efficiency” (NBA average) and personalized efficiency. In cases like SGA, it makes all the difference. |
For coaches and players:
It’s not about banning twos or idolizing threes.
It’s about recognizing good shots and building a system that consistently produces them.
It’s about educating for choice, not limitation.
For analysts and trainers:
Data must be read carefully and used as support tools, not verdicts.
Learn to distinguish systemic efficiency from individual efficiency.
Sources
- SGA seasonal stats (2024–25): 32.7 PPG, 51.9 FG%, 37.5 3P%, 6.4 AST, 5.0 REB — ESPN, StatMuse, usustatesman.com
- NBA average efficiency by shot area: Cleaning the Glass (midrange least efficient ~0.79–0.95 PPS; corner-3 and restricted area dominate ~1.1–1.2 PPS)
- Shot zones and accuracy: Cleaning the Glass
- Academic analysis of corner threes: LinkedIn, arxiv.org, Washington Post
- Impact of analytics on shot selection (PPS): StatMuse, Washington Post, Hooper University
Tools Used
| Tool / Source | Main Use |
|---|---|
| Synergy Sports Technology | Shot charts, play-type analysis, video tracking, scouting, team development |
| Second Spectrum (NBA) | Advanced optical tracking, shot quality metrics (qSQ, qSI), visual analysis |
| Cleaning the Glass | Benchmark PPS by shot area, comparative analysis |
| NBA Stats / InStat | Shooter profiling (TS%, eFG%, volume, contest %, assisted vs pull-up) |
| CourtVision App (Second Spectrum) | Dynamic visualization of shot quality/hardness during games |
Credits
Who is Michele Vischi
To complete this work, it is important to introduce Michele Vischi, co-author and invaluable collaborator in the analysis of mid-range shots and the advanced concepts discussed.
Michele is a former basketball player, raised in the youth programs of Trieste, with years of experience in senior leagues across Friuli Venezia Giulia. After hanging up his sneakers, he embarked on an impressive academic path: today he holds a PhD in Physics and works on Quantum Computing at the ICTP (International Centre for Theoretical Physics) in Trieste, one of the most prestigious research centers in the world.
His scientific background, combined with his athletic past, allows him to merge analytical rigor with basketball intuition, providing innovative insights into data without losing sight of the human dimension of the game. In this article, he offered a perspective that is both technical and empathetic on the importance of the mid-range in modern basketball, demonstrating how numbers and perception can — and should — coexist.
His presence is concrete proof that, in 2025, multidisciplinarity is a strength, and that it is possible to move from the court to the lab without ever ceasing to observe the game with intelligence and passion.